Your market planning playbook just went global
-
 Michael Simon

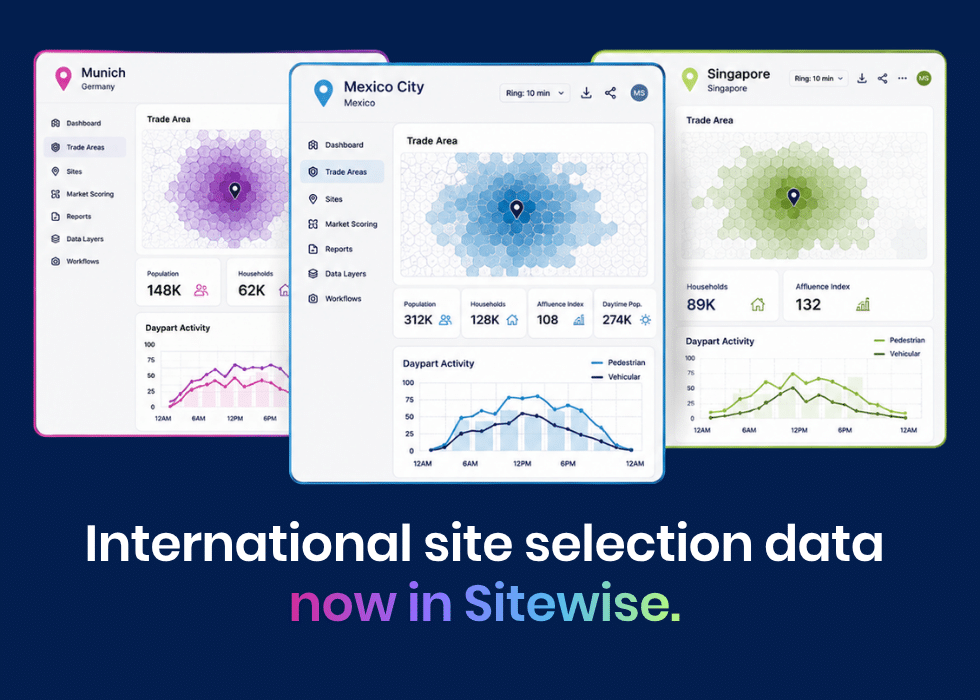
You’ve been asking us for it, and it’s here. International demographic, retail, and mobility data for site selection is now available in Sitewise!
We took the time to find a data partner that meets our bar for quality and coverage. Your international real estate team can access global market planning data across 100+ markets in Europe, Asia, the Middle East, Australasia and Latin America – in the same Sitewise Platform you already use every day.
Expanding across borders used to mean rebuilding the data layer market by market. Now, Sitewise brings your global site selection data into one consistent framework. No second platform. No rebuilding your reporting workflow every time you enter another market.
What international data is available in Sitewise?
International demographic, movement, and retail data come together in Sitewise in one consistent framework to support global real estate analytics for retail, restaurant and service brands.
Demographics
How many people live near a site and who they are. It's the size and shape of your customer base before you ever open a door.
- Built for standardized definitions built from census, survey, employment, and economic indicators
- Population, households, gender, and age bands
- A nationally scaled affluence index (100 = each country's average)
- An urbanicity classification that grades each area from urban to rural, for segmenting trade areas)

Mobility
How much activity happens near a site and when. It turns real-world movement into insight: whether people pass a location, not just whether they live nearby.
- Activity across 7 dayparts, plus weekday and weekend
- Travel mode and dwell time: pedestrian vs. vehicular and where people linger vs. pass through
- Residential vs. workday activity: whether an area is driven by people who live there or people who work there)

Retail and restaurant locations
What brands are already operating in a market and where.
- Named, categorized locations for major retail, restaurant and service brands
- Travel mode and dwell time: pedestrian vs. vehicular and where people linger vs. pass through

Geography and refresh
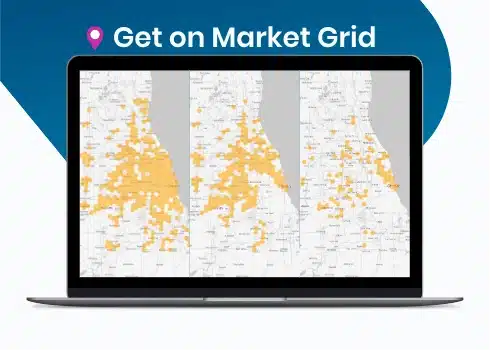
- A consistent ~350m hex grid across markets – fine enough to model walk-up catchments
- Annual data refresh, baked into the subscription
- Mobility availability varies by market – it isn't offered in every country yet
- Retail and restaurant coverage is growing. Not every brand is available to add, but we'd love to hear which ones you want to add

How can brands use existing Sitewise tools internationally?
Build a report or data visualization for one international market and run the same analysis across the other markets you license. The look and feel of your solutions stay consistent – you’re not starting over every time you cross a border.
With international data in Sitewise, you can compare market potential, understand activity by daypart and identify established retail clusters before prioritizing individual opportunities. You can also:
- Run global trade area analysis across the international markets you license and create site evaluation criteria, using consistent report structures and common variables
- Rank and sequence your target markets on comparable data to decide where to expand next – Geneva vs. Lyon, Osaka vs. Nagoya
- Create a data-backed strategic growth map to share with local brokers or franchise partners
- Analyze how people move through a market by daypart, weekday, and weekend
- Identify major anchors and clusters of retail activity and see where your competitors cluster – find the gaps worth entering
- Create rich Site Approval Packages in seconds and focus your time on making strategic decisions
- Map and track franchise territories – available, pending, and sold – in one view
We can help you wherever you grow
If you’re planning your next international market, contact us to book a short walkthrough. Tell us the countries you’re considering and we’ll come prepared.
International site selection data FAQ
What countries are included in Sitewise international data?
In total, Sitewise international data covers 100+ markets, with consistent demographic variables across the covered markets and mobility available in selected locations.
Coverage current as of July 2026: Europe, Asia, the Middle East, Australasia and Latin America.
How is Sitewise international data different than other global data?
Unlike fragmented international data sources, Sitewise gives you a consistent, cross-border dataset designed specifically for site selection and market planning.
Does international data in Sitewise include foot traffic and mobility?
Yes, in most markets. In fact, our mobility data uses the same ~350-meter hex grid as the demographic data. It splits across time of day (7 dayparts), day of week, and travel mode (pedestrian and vehicular), and is calibrated per country. Mobility isn’t available in every market yet – check coverage for the countries you’re considering.
What geographic resolution does the international data use?
Resolution goes down to ~350-meter hex grids (H3 resolution 9) – fine enough to model walk-up catchments.
How often is international data refreshed?
We refresh demographic, mobility and retail places datasets annually. We refresh ChainXY retail location data every three to six months, depending on the chain.
How is mobility data different from demographics?
In short, they answer different questions.
Demographics tell you who lives near a site – population, households, age, and affluence.
Mobility tells you how much activity actually happens there, and when. It’s built from de-duplicated mobile device data, not census or surveys. These aggregated mobility signals reflect foot and vehicle traffic by time of day. so it reflects real foot and vehicle traffic by time of day. For instance, a place can have modest population but heavy activity – a transit hub, a business district, a tourist strip – or the reverse.
So, read them together: demographics shows who’s nearby, mobility shows whether they actually pass by.
How does the international mobility data address privacy concerns?
Mobility data is device-de-duplicated, aggregated to ~350-meter hex cells, and never individual.
Can I compare two countries side-by-side in Sitewise?
Yes. We deliver the international dataset on a common geographic framework (the same ~350-meter hex grid in every market) using the same variable definitions. So you can pull a trade area in Geneva, pull one in Lyon, and analyze markets using common variables available in both locations, while accounting for country-specific measures such as the affluence index.
How is affluence measured across countries?
The affluence index is calibrated within each country (national average = 100). An “affluence = 130” hex in Vietnam and an “affluence = 130” hex in Switzerland do not represent the same absolute purchasing power – each means “30% above the national average for that country.”
How is the international dataset built?
International demographic data is compiled from market-specific census, survey, employment and economic sources, then standardized into common variable definitions and mapped to an H3 resolution 9 geographic grid.
Where available, mobility data is built from de-duplicated, aggregated device signals and summarized by daypart, weekday versus weekend, pedestrian versus vehicular activity, dwell time and residential versus workday activity. Retail location data includes named and categorized brand locations and retail areas.
Overall, data availability and source coverage vary by market.
Do I need a subscription to access international data in Sitewise?
Yes. International demographic and mobility data is available as an add-on dataset. Contact our team to explore coverage and pricing.