Sales estimates for site selection, plus who a location’s customers really are: when they spend, how often they come back, how much they spend and where else they shop.
-
 Michael Simon

Why site selection needs sales estimates
Ask any real estate team what they want for site selection, and sales estimates for competitors, co-tenants and retail anchors are near the top of the list.
That’s because you already know what’s around a potential site. Demographics tell you who lives and works nearby. Foot traffic tells you how people move. Your own sales history tells you what works for your brand. And your map shows you the competitors, co-tenants and retail anchors in the area.
But not every logo on the map is equal.

The map tells you who’s there, not how much business they do or whose dollars drive it. Card transaction data can fill that gap, but estimating sales accurately at the individual store level is a hard problem. Spend Intelligence estimates are validated against actual sales data and show a strong correlation with real store performance. It’s live in Sitewise today.
Follow the money. Find your customers.
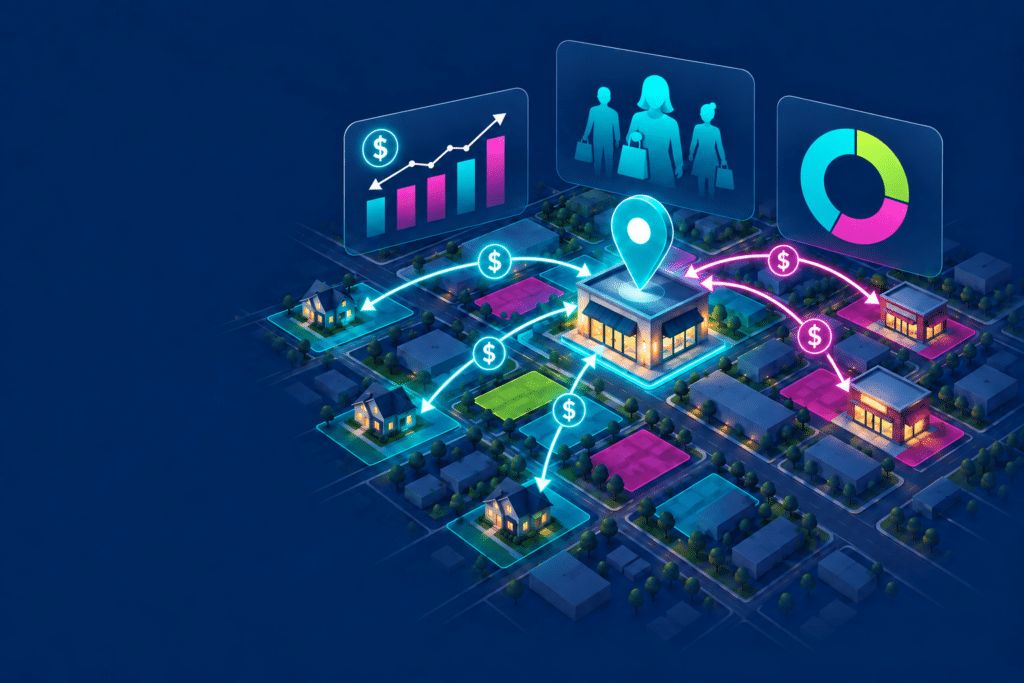
Spend Intelligence starts with aggregated credit and debit card transactions in the United States and attributes them to retail and restaurant chain locations to estimate sales. You can see who spends at a location, when they buy, how much they typically spend and how often they open their wallets there.
This turns card spending into a clear view of which locations are winning and whose dollars are driving that performance. You can look at it from two directions:
Location performance and who drives it
Estimated sales and trends for any location, benchmarked against its brand and its category, and the customers behind them: who they are, when they spend, where they live and where else they shop.
Brand and category demand: Who captures it and how it’s trending
See how much is spent on your category in a market, which brands are winning it and whether they’re gaining or losing ground over 24 months. Then look inside the market to see which neighborhoods spend the most and where your brand captures less than it could.
What's in the data
You may have had spending data on your map before. What you haven’t had is spending data you could build decisions on: measured performance and consumer behavior, validated against actual sales. Here’s what’s in Spend Intelligence.
Sales estimates for individual locations across restaurant, retail and service chains, built from aggregated credit and debit card transactions and validated against actual sales data.
A performance index and letter grade for each location, plus where it ranks within its brand and its category, nationally, by state and by market.
24 months of sales against market and national benchmarks, with year-over-year change in sales, transactions and average check.
How many purchases a location records and how many customers make them, with year-over-year change.
How spending at a location breaks down by daypart and day of week, against the brand average.
Average purchases per customer at a location each month, compared against the brand norms.
The income, age, household makeup, homeownership and more of the people who actually spend at a location.
The share of a location’s sales that comes from each neighborhood (block group), and how far customers travel to get there.
The other brands and locations where a location’s customers also spend.
How much is spent on a category or brand in any market, which brands capture it and whether their share is growing or shrinking, from the whole market down to the neighborhood.
For the residents of any neighborhood, which locations they spend at and how much, so you can see whether they already shop at the site you’re looking at, or which locations they’re choosing over yours.
Put Spend Intelligence to work in Sitewise
That’s a lot of intelligence. The best part is that Spend Intelligence lives in the Sitewise maps, panels, reports and models you already use. No jumping between platforms to put the pieces together. Here are some of the questions it helps you answer.

Which markets should we prioritize?
See how much is spent on your category in each market, and whether it’s growing. Then see how the brands in it are trending: who’s gaining share and who’s opening new locations. Combine that with everything else you already know in Sitewise, and you can rank your markets and grow strategically instead of guessing.
Where is demand strongest?
See how much the residents of each neighborhood spend on a category or brand, in total and per capita, and find where demand is strong and your brand captures less than it could. A heat map of your category’s locations shows the other side: where that demand is already turning into strong stores.
Is this center worth it, beyond the tenant list?
Grades and ranks show which tenants and retail anchors are strong performers and which only look busy, so you can judge shopping center performance on evidence. See who spends with them and when, whether your target co-tenants actually thrive there and which brands share your customers.
Will the people nearby actually shop here?
See where the residents of the surrounding neighborhoods spend today and how much, so you know whether they already shop at this site and its center, or which locations you’d have to win them from.

Why is this location underperforming, and what do we do about it?
Is the whole brand down, or just this store? Is the whole center down, or just this location? Compare the location’s 24-month trend with the brand’s market and national averages and with the locations around it. Then use transactions and average check to see what’s driving the gap. When a location is outperforming, the same view shows why, so you can repeat it.

Are we reaching the right customers, and who are we missing?
Compare the people who actually spend at a location with the residents of its trade area. If the profiles differ, you’ve found your gap: the customers nearby who aren’t shopping with you yet. That means your marketing gets two clear plays: convert the customers you’re missing, or double down on the customers you’re already winning.
How do we give a new opening the strongest start?
Stock, staff and promote for the people who really shop there. Before opening day, see who the center’s customers actually are and when they spend by daypart and day of week. Then check whether it runs on regulars or one-time visitors, so nothing about the launch is a guess.

People don’t always spend where traditional data suggests they will. Spend Intelligence adds the outcome to your model, how the businesses around a site actually perform, so it learns from results, not just surroundings. It complements the demographic, traffic, competitive and other data already in your model rather than replacing it. It’s always used in context, never in isolation, so your predictions stay reliable.
Competitors weighted by performance, not just counted.
A competitor doesn’t mean the same thing in every market or every trade area. With spending data, the model can measure how strong each competitor is where it sits, and how its presence actually relates to sales in the area.
Centers scored on sales and customers who actually spend, not just tenant lists.
Instead of relying on square footage and proxies, the model can score a center’s draw from how its tenants and retail anchors actually perform, how shoppers move between them and which brands share your customers. It learns which neighbors bring you the right audience and which compete for it.
Learn from similar brands, not just your own stores.
Brands with a similar customer and format show where demand in your category turns into strong stores, and category spending shows how much that demand is worth in any market, whatever brand captures it. Your model learns from the market before you’ve opened a location in it.
See it where you work.
Turn on the layers alongside your own stores, your strategic growth plan and everything else on your map. Open a location’s panel for the detail, then run a print-ready location report to share with your team.
Use it in everything you produce.
Integrate the data directly into your site approval packages and other Sitewise solutions, so your team isn’t moving between platforms or rebuilding the same analysis for every decision. Everything in one place, and time saved on every decision.
How the sales estimates for site selection work

So, are these exact sales figures? No. And they don’t need to be.
They’re built from aggregated credit and debit card transactions, so they’re best read as a relative measure of performance, not a recreation of anyone’s sales. We validate estimates against actual sales data, so you can compare locations consistently and see which appear stronger or weaker than their peers, even when you don’t have their actual sales.
How transactions reveal customer insights
- Audience demographics. Core demographics attached to each card roll up into an aggregated profile of the people who spend at a location.
- Customer origins. Knowing which neighborhood cardholders live in shows where a location’s sales come from.
- Customer shopping journey. Because transactions connect to the same card, we can see which other brands and locations a location’s customers also spend with, reported in aggregate.
Transactions are the source. Spend Intelligence is the layer. Better decisions are the result.
Why you can trust Spend Intelligence
There’s no shortage of data that claims to tell you how retail locations perform. We’ve looked at a lot of it, and so have our clients. The story was usually the same: useful for a rough read, not reliable enough to build a decision on.
So we kept looking because we don’t add data just to put another number on the map.
We evaluated the leading providers and tested them against real sales. Before launch, clients across industries, regions and location types volunteered their actual sales so we could put these estimates through deep testing. Validation against actual sales data showed a strong correlation, and the estimates were even more accurate at what matters most: how one location performs against another.
Then we built the mapping layers, dashboards and reports that turn the raw data into something your team can act on, inside the Sitewise workflow you already use.

Ready to see how your markets really perform?
We’d love to show you all the ways you can put Spend Intelligence to work. We’re planning a webinar for December 2, so keep your eyes peeled. If you want more details today, we have two options for you:
- Already a Sitewise client? Your success manager can turn it on and walk you through how we tested it so you’re as confident in it as we are. Then look at a market you know with a question you’ve been trying to answer.
- New to Sitewise? We’ll show you Spend Intelligence alongside everything else Sitewise does for location intelligence.
Sales estimates for site selection: FAQs
What is consumer spending data for site selection
Consumer spending data adds measured sales performance and real customer behavior to the data you already use for market planning and site selection. Built from aggregated credit and debit card transactions, Spend Intelligence shows how locations perform against their peers. It also shows who spends there, when, how often and where else they shop. That means you can evaluate sites and markets on what actually happens there, not just what’s nearby.
How can transaction data improve site selection?
Transaction data adds sales performance to the other signals you already use for site selection. Use it to see how competitors, co-tenants and retail anchors perform, compare shopping centers, see where customers come from and understand who actually spends at a location. Alongside demographics, foot traffic, your own sales history and other market data, it gives you another layer of evidence when evaluating a potential site.
What data should you use for site selection?
Spend Intelligence adds sales estimates for site selection, but there’s no single dataset that answers every question. Strong market and site analysis combines demographics, footfall and visitation, traffic, trade areas, your own location and sales history, competitive data, customer behavior and sales performance. Each answers a different part of the question. Spend Intelligence adds sales estimates for the businesses in and around a potential site or shopping center, plus who the customers behind that performance are.
How can I tell how well a competitor's location is performing?
Knowing where a competitor is located only tells you part of the story. Competitor sales estimates built from card transactions let you compare individual locations against their peers, so you’re not treating every competitor on the map as equal.
Can you estimate competitor sales without access to their POS data?
Aggregated credit and debit card transactions can be attributed to individual locations to estimate their sales, with no access to anyone’s POS system. The goal isn’t to reproduce a competitor’s exact sales figures. It’s to compare locations consistently, so you can see which are stronger or weaker than their peers. Spend Intelligence validates those estimates against actual sales from Sitewise clients.
How can I see which brands are gaining market share?
Spend Intelligence shows each brand’s category market share in any market, from the whole market down to the neighborhood, with 24 months of history. You can see who leads a category in a market, who’s gaining ground, who’s losing it and whether spending in the category itself is growing.
How can I tell which co-tenants perform well?
Start with the brands that tend to work alongside your concept, then look at how their individual locations perform. Sales estimates and performance grades show where your target co-tenants are strongest, and cross-shopping shows which brands share your customers, so you’re choosing neighbors on evidence rather than on the tenant list.
How can I tell where a location's customers come from and where else they shop?
Card transaction data answers both. Customer origins show which neighborhoods (block groups) a location’s sales come from and how far people travel, so you can define a trade area on actual customer behavior rather than a radius or drive time. Cross-shopping shows where those same customers also spend, which tells you which brands share your audience and which centers fit your concept.
What's the difference between foot traffic and transaction data for site selection?
Foot traffic shows where people go. Transaction data shows what they spent when they got there. The two don’t always agree: a location can look busy because it’s picking up traffic from the stores around it, or because it serves a lot of people with a low average check. Transaction data tells you how much business actually gets done, and who’s doing it. Used together, they give you a fuller picture of a site.
How accurate are the sales estimates in Sitewise Spend Intelligence?
Before bringing Spend Intelligence into Sitewise, we tested the estimates against actual sales from clients who volunteered their data, across industries, regions and location types. The estimates showed a strong correlation with actual sales, and the comparisons between locations were even more accurate. They’re designed for comparing locations against their peers, not for recreating anyone’s exact sales.